
Point cloud visualisation#
Goal#
In this tutorial you will:
Load and save point cloud data
Visualise your data
Requirements#
For visualisations you need to compile OpenCV library with OpenGL support. For this you should set WITH_OPENGL flag ON in CMake while building OpenCV from source.
Practice#
Loading and saving of point cloud can be done using cv::loadPointCloud and cv::savePointCloud accordingly.
Currently supported formats are:
.OBJ (supported keys are v(which is responsible for point position), vn(normal coordinates) and f(faces of a mesh), other keys are ignored)
.PLY (all encoding types(ascii and byte) are supported with limitation to only float type for data)
vertices, normals = cv2.loadPointCloud("teapot.obj")
Function cv::loadPointCloud returns vector of points of float (cv::Point3f) and vector of their normals(if specified in source file).
To visualize it you can use functions from viz3d module and it is needed to reinterpret data into another format
vertices = np.squeeze(vertices, axis=1)

color = [1.0, 1.0, 0.0]
colors = np.tile(color, (vertices.shape[0], 1))
obj_pts = np.concatenate((vertices, colors), axis=1).astype(np.float32)

cv2.viz3d.showPoints("Window", "Points", obj_pts)

cv2.waitKey(0)
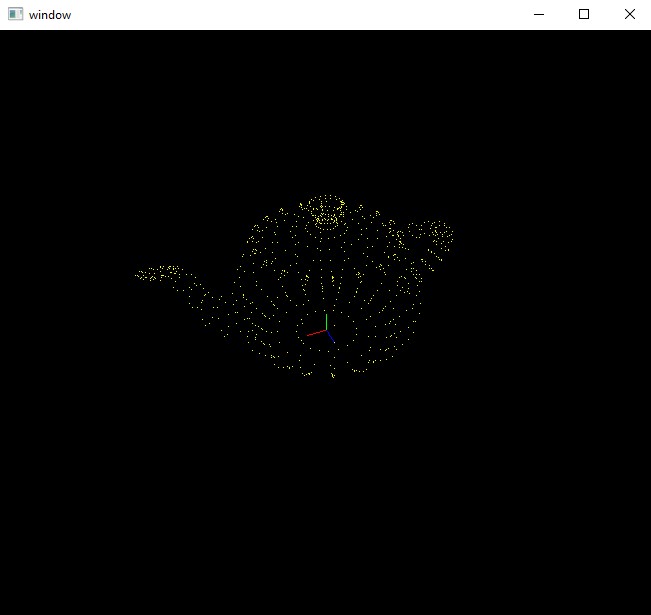
In presented code sample we add a colour attribute to every point Result will be:
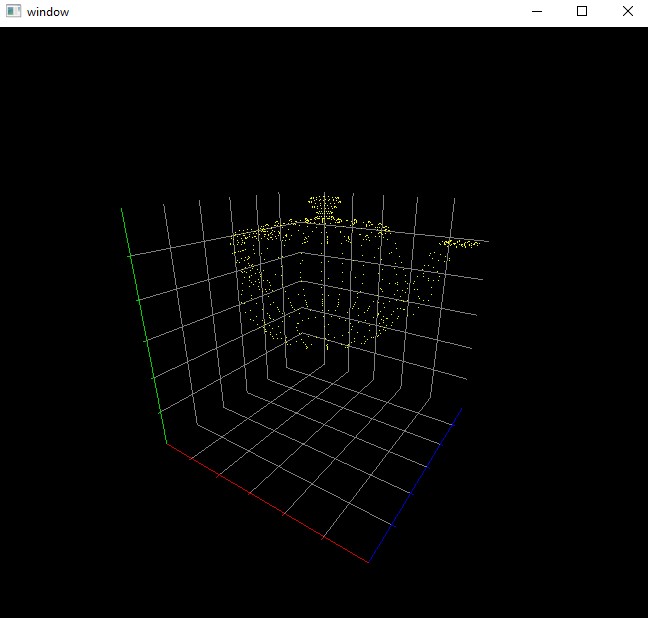
For additional info grid can be added
vertices, normals = cv2.loadPointCloud("teapot.obj")
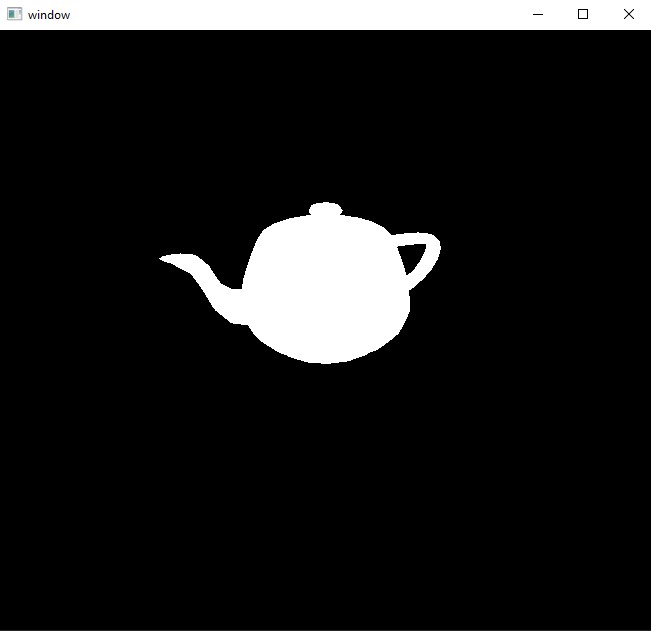
Other possible way to draw 3d objects can be a mesh. For that we use special functions to load mesh data and display it. Here for now only .OBJ files are supported and they should be triangulated before processing (triangulation - process of breaking faces into triangles).
vertices, indices = cv2.loadMesh("../data/teapot.obj")
vertices = np.squeeze(vertices, axis=1)

cv2.viz3d.showMesh("window", "mesh", vertices, indices)