|
OpenCV
4.5.5
Open Source Computer Vision
|
|
OpenCV
4.5.5
Open Source Computer Vision
|
So what is histogram ? You can consider histogram as a graph or plot, which gives you an overall idea about the intensity distribution of an image. It is a plot with pixel values (ranging from 0 to 255, not always) in X-axis and corresponding number of pixels in the image on Y-axis.
It is just another way of understanding the image. By looking at the histogram of an image, you get intuition about contrast, brightness, intensity distribution etc of that image. Almost all image processing tools today, provides features on histogram. Below is an image from Cambridge in Color website, and I recommend you to visit the site for more details.
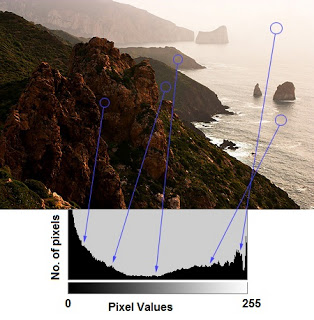
You can see the image and its histogram. (Remember, this histogram is drawn for grayscale image, not color image). Left region of histogram shows the amount of darker pixels in image and right region shows the amount of brighter pixels. From the histogram, you can see dark region is more than brighter region, and amount of midtones (pixel values in mid-range, say around 127) are very less.
We use the function: cv.calcHist (image, channels, mask, hist, histSize, ranges, accumulate = false)
| image | source arrays. They all should have the same depth, cv.CV_8U, cv.CV_16U or cv.CV_32F , and the same size. Each of them can have an arbitrary number of channels. |
| channels | list of the dims channels used to compute the histogram. |
| mask | optional mask. If the matrix is not empty, it must be an 8-bit array of the same size as images[i] . The non-zero mask elements mark the array elements counted in the histogram. |
| hist | output histogram(cv.CV_32F type), which is a dense or sparse dims -dimensional array. |
| histSize | array of histogram sizes in each dimension. |
| ranges | array of the dims arrays of the histogram bin boundaries in each dimension. |
| accumulate | accumulation flag. If it is set, the histogram is not cleared in the beginning when it is allocated. This feature enables you to compute a single histogram from several sets of arrays, or to update the histogram in time. |
 1.8.13