OpenCV  3.3.1
Open Source Computer Vision
Creating Bounding boxes and circles for contours

Goal

In this tutorial you will learn how to:

Theory

Code

This tutorial code's is shown lines below. You can also download it from here

#include <iostream>
using namespace cv;
using namespace std;
Mat src; Mat src_gray;
int thresh = 100;
int max_thresh = 255;
RNG rng(12345);
void thresh_callback(int, void* );
int main( int, char** argv )
{
src = imread( argv[1], IMREAD_COLOR );
cvtColor( src, src_gray, COLOR_BGR2GRAY );
blur( src_gray, src_gray, Size(3,3) );
const char* source_window = "Source";
namedWindow( source_window, WINDOW_AUTOSIZE );
imshow( source_window, src );
createTrackbar( " Threshold:", "Source", &thresh, max_thresh, thresh_callback );
thresh_callback( 0, 0 );
waitKey(0);
return(0);
}
void thresh_callback(int, void* )
{
Mat threshold_output;
vector<vector<Point> > contours;
vector<Vec4i> hierarchy;
threshold( src_gray, threshold_output, thresh, 255, THRESH_BINARY );
findContours( threshold_output, contours, hierarchy, RETR_TREE, CHAIN_APPROX_SIMPLE, Point(0, 0) );
vector<vector<Point> > contours_poly( contours.size() );
vector<Rect> boundRect( contours.size() );
vector<Point2f>center( contours.size() );
vector<float>radius( contours.size() );
for( size_t i = 0; i < contours.size(); i++ )
{
approxPolyDP( Mat(contours[i]), contours_poly[i], 3, true );
boundRect[i] = boundingRect( Mat(contours_poly[i]) );
minEnclosingCircle( contours_poly[i], center[i], radius[i] );
}
Mat drawing = Mat::zeros( threshold_output.size(), CV_8UC3 );
for( size_t i = 0; i< contours.size(); i++ )
{
Scalar color = Scalar( rng.uniform(0, 255), rng.uniform(0,255), rng.uniform(0,255) );
drawContours( drawing, contours_poly, (int)i, color, 1, 8, vector<Vec4i>(), 0, Point() );
rectangle( drawing, boundRect[i].tl(), boundRect[i].br(), color, 2, 8, 0 );
circle( drawing, center[i], (int)radius[i], color, 2, 8, 0 );
}
namedWindow( "Contours", WINDOW_AUTOSIZE );
imshow( "Contours", drawing );
}

Explanation

The main function is rather simple, as follows from the comments we do the following:

  1. Open the image, convert it into grayscale and blur it to get rid of the noise.
    src = imread( argv[1], IMREAD_COLOR );
    cvtColor( src, src_gray, COLOR_BGR2GRAY );
    blur( src_gray, src_gray, Size(3,3) );
  2. Create a window with header "Source" and display the source file in it.
    const char* source_window = "Source";
    namedWindow( source_window, WINDOW_AUTOSIZE );
    imshow( source_window, src );
  3. Create a trackbar on the source_window and assign a callback function to it In general callback functions are used to react to some kind of signal, in our case it's trackbar's state change.
    createTrackbar( " Threshold:", "Source", &thresh, max_thresh, thresh_callback );
  4. Explicit one-time call of 
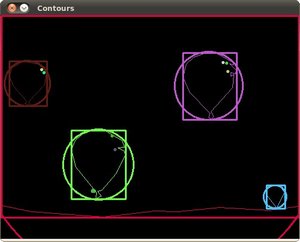
thresh_callback is necessary to display the "Contours" window simultaniously with the "Source" window.
    thresh_callback( 0, 0 );
  5. Wait for user to close the windows.
    waitKey(0);

The callback function thresh_callback does all the interesting job.

  1. Writes to 
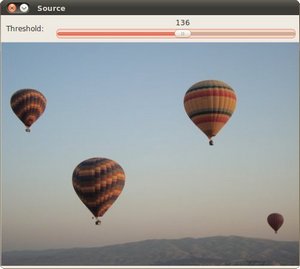
threshold_output the threshold of the grayscale picture (you can check out about thresholding here).
    threshold( src_gray, threshold_output, thresh, 255, THRESH_BINARY );
  2. Finds contours and saves them to the vectors contour and hierarchy.
    findContours( threshold_output, contours, hierarchy, RETR_TREE, CHAIN_APPROX_SIMPLE, Point(0, 0) );
  3. For every found contour we now apply approximation to polygons with accuracy +-3 and stating that the curve must me closed.

    After that we find a bounding rect for every polygon and save it to boundRect.

    At last we find a minimum enclosing circle for every polygon and save it to center and radius vectors.

    for( size_t i = 0; i < contours.size(); i++ )
    {
    approxPolyDP( Mat(contours[i]), contours_poly[i], 3, true );
    boundRect[i] = boundingRect( Mat(contours_poly[i]) );
    minEnclosingCircle( contours_poly[i], center[i], radius[i] );
    }

    We found everything we need, all we have to do is to draw.

  4. Create new Mat of unsigned 8-bit chars, filled with zeros. It will contain all the drawings we are going to make (rects and circles).
    Mat drawing = Mat::zeros( threshold_output.size(), CV_8UC3 );
  5. For every contour: pick a random color, draw the contour, the bounding rectangle and the minimal enclosing circle with it,
    for( size_t i = 0; i< contours.size(); i++ )
    {
    Scalar color = Scalar( rng.uniform(0, 255), rng.uniform(0,255), rng.uniform(0,255) );
    drawContours( drawing, contours_poly, (int)i, color, 1, 8, vector<Vec4i>(), 0, Point() );
    rectangle( drawing, boundRect[i].tl(), boundRect[i].br(), color, 2, 8, 0 );
    circle( drawing, center[i], (int)radius[i], color, 2, 8, 0 );
    }
  6. Display the results: create a new window "Contours" and show everything we added to drawings on it.
    namedWindow( "Contours", WINDOW_AUTOSIZE );
    imshow( "Contours", drawing );

    Result

Here it is:

Bounding_Rects_Circles_Source_Image.jpg
Bounding_Rects_Circles_Result.jpg