Use the function cv2.imread() to read an image. The image should be in the working directory or a full path of image should be given.
Second argument is a flag which specifies the way image should be read.
Note
Instead of these three flags, you can simply pass integers 1, 0 or -1 respectively.
See the code below:
import numpy as np
import cv2

# Load an color image in grayscale
img = cv2.imread('messi5.jpg',0)
Warning
Even if the image path is wrong, it won’t throw any error, but print img will give you None
Use the function cv2.imshow() to display an image in a window. The window automatically fits to the image size.
First argument is a window name which is a string. second argument is our image. You can create as many windows as you wish, but with different window names.
cv2.imshow('image',img)
cv2.waitKey(0)
cv2.destroyAllWindows()
A screenshot of the window will look like this (in Fedora-Gnome machine):
cv2.waitKey() is a keyboard binding function. Its argument is the time in milliseconds. The function waits for specified milliseconds for any keyboard event. If you press any key in that time, the program continues. If 0 is passed, it waits indefinitely for a key stroke. It can also be set to detect specific key strokes like, if key a is pressed etc which we will discuss below.
Note
Besides binding keyboard events this function also processes many other GUI events, so you MUST use it to actually display the image.
cv2.destroyAllWindows() simply destroys all the windows we created. If you want to destroy any specific window, use the function cv2.destroyWindow() where you pass the exact window name as the argument.
Note
There is a special case where you can already create a window and load image to it later. In that case, you can specify whether window is resizable or not. It is done with the function cv2.namedWindow(). By default, the flag is cv2.WINDOW_AUTOSIZE. But if you specify flag to be cv2.WINDOW_NORMAL, you can resize window. It will be helpful when image is too large in dimension and adding track bar to windows.
See the code below:
cv2.namedWindow('image', cv2.WINDOW_NORMAL)
cv2.imshow('image',img)
cv2.waitKey(0)
cv2.destroyAllWindows()
Use the function cv2.imwrite() to save an image.
First argument is the file name, second argument is the image you want to save.
cv2.imwrite('messigray.png',img)
This will save the image in PNG format in the working directory.
Below program loads an image in grayscale, displays it, save the image if you press ‘s’ and exit, or simply exit without saving if you press ESC key.
import numpy as np
import cv2

img = cv2.imread('messi5.jpg',0)
cv2.imshow('image',img)
k = cv2.waitKey(0)
if k == 27:         # wait for ESC key to exit
    cv2.destroyAllWindows()
elif k == ord('s'): # wait for 's' key to save and exit
    cv2.imwrite('messigray.png',img)
    cv2.destroyAllWindows()
Warning
If you are using a 64-bit machine, you will have to modify k = cv2.waitKey(0) line as follows : k = cv2.waitKey(0) & 0xFF
Matplotlib is a plotting library for Python which gives you wide variety of plotting methods. You will see them in coming articles. Here, you will learn how to display image with Matplotlib. You can zoom images, save it etc using Matplotlib.
import numpy as np
import cv2
from matplotlib import pyplot as plt

img = cv2.imread('messi5.jpg',0)
plt.imshow(img, cmap = 'gray', interpolation = 'bicubic')
plt.xticks([]), plt.yticks([])  # to hide tick values on X and Y axis
plt.show()
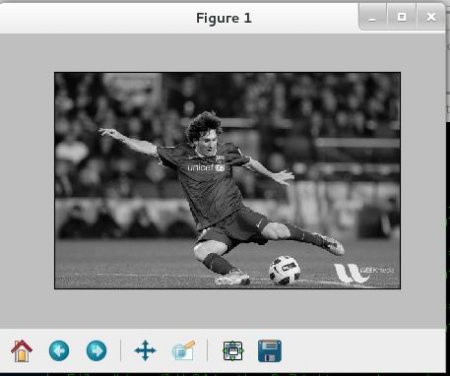
A screen-shot of the window will look like this :
See also
Plenty of plotting options are available in Matplotlib. Please refer to Matplotlib docs for more details. Some, we will see on the way.
Warning
Color image loaded by OpenCV is in BGR mode. But Matplotlib displays in RGB mode. So color images will not be displayed correctly in Matplotlib if image is read with OpenCV. Please see the exercises for more details.